PhytoplanktonGallery-BlueCloud
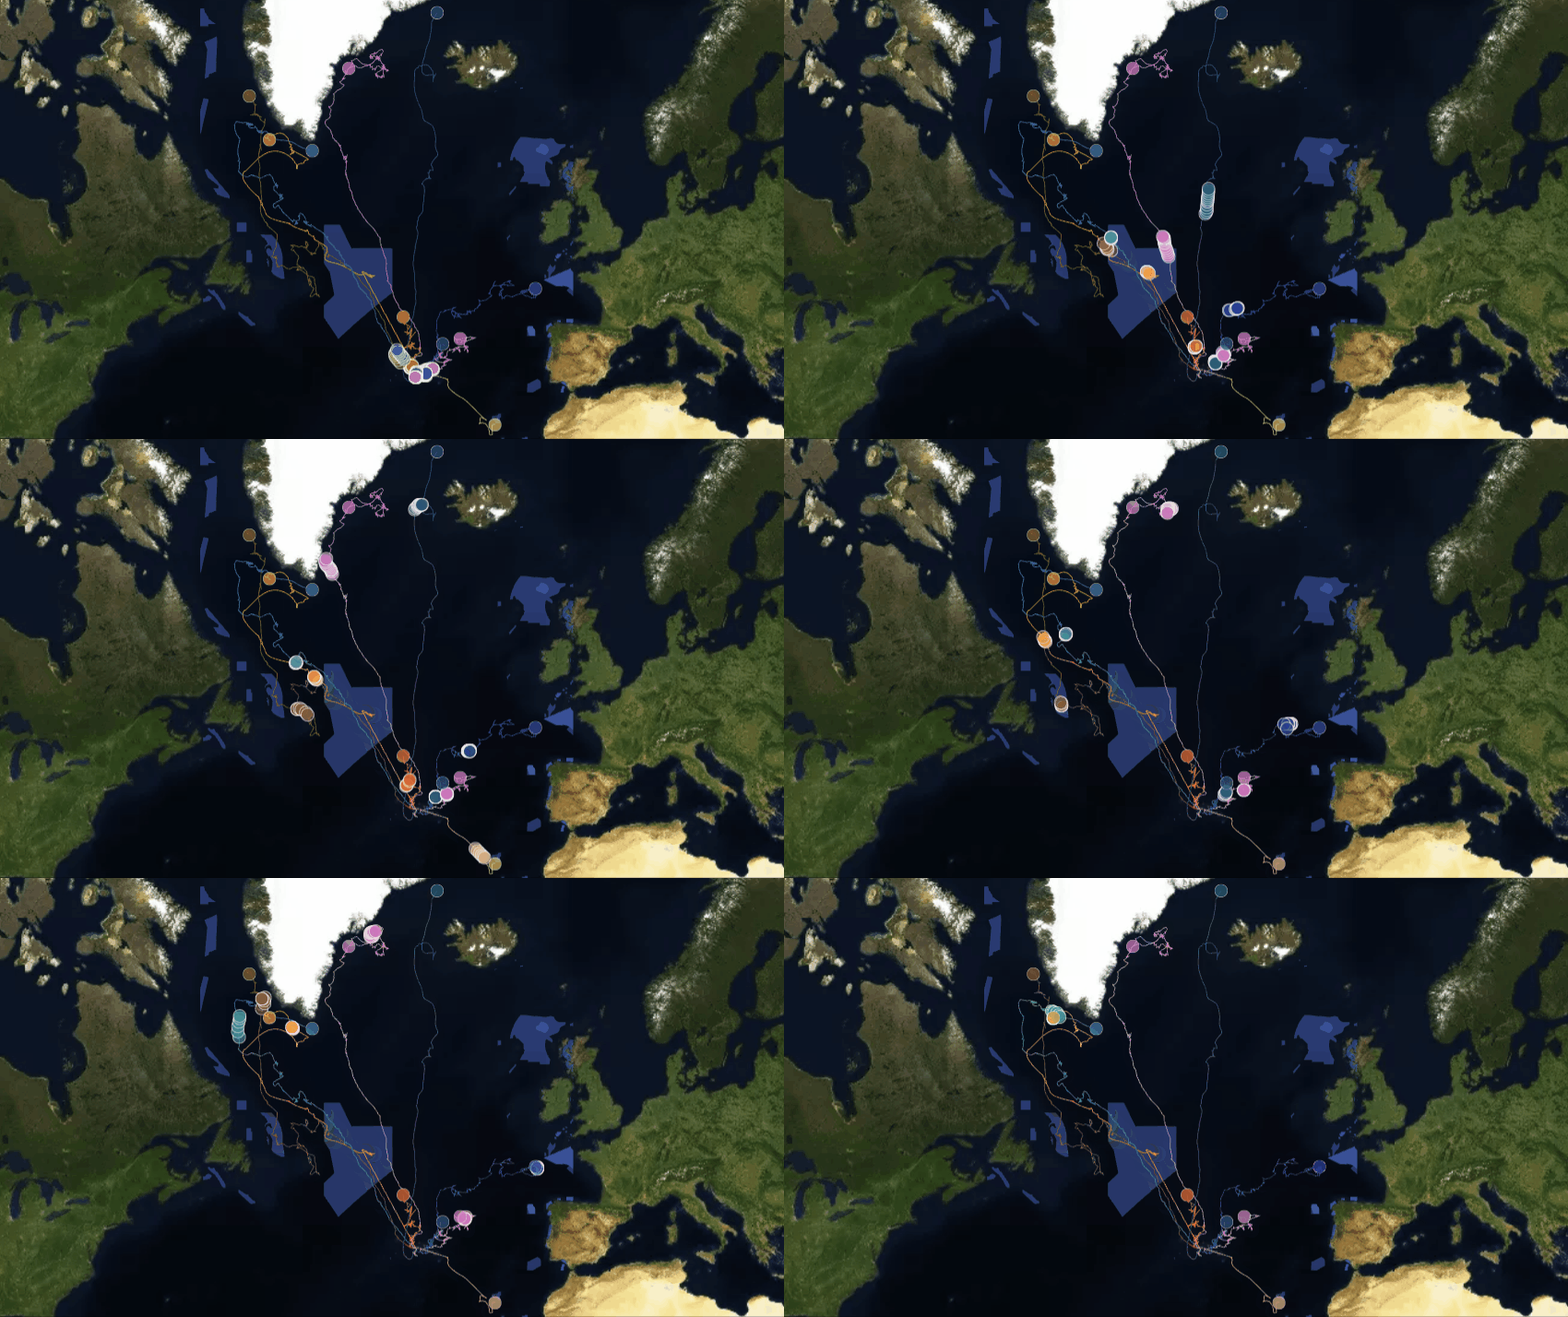
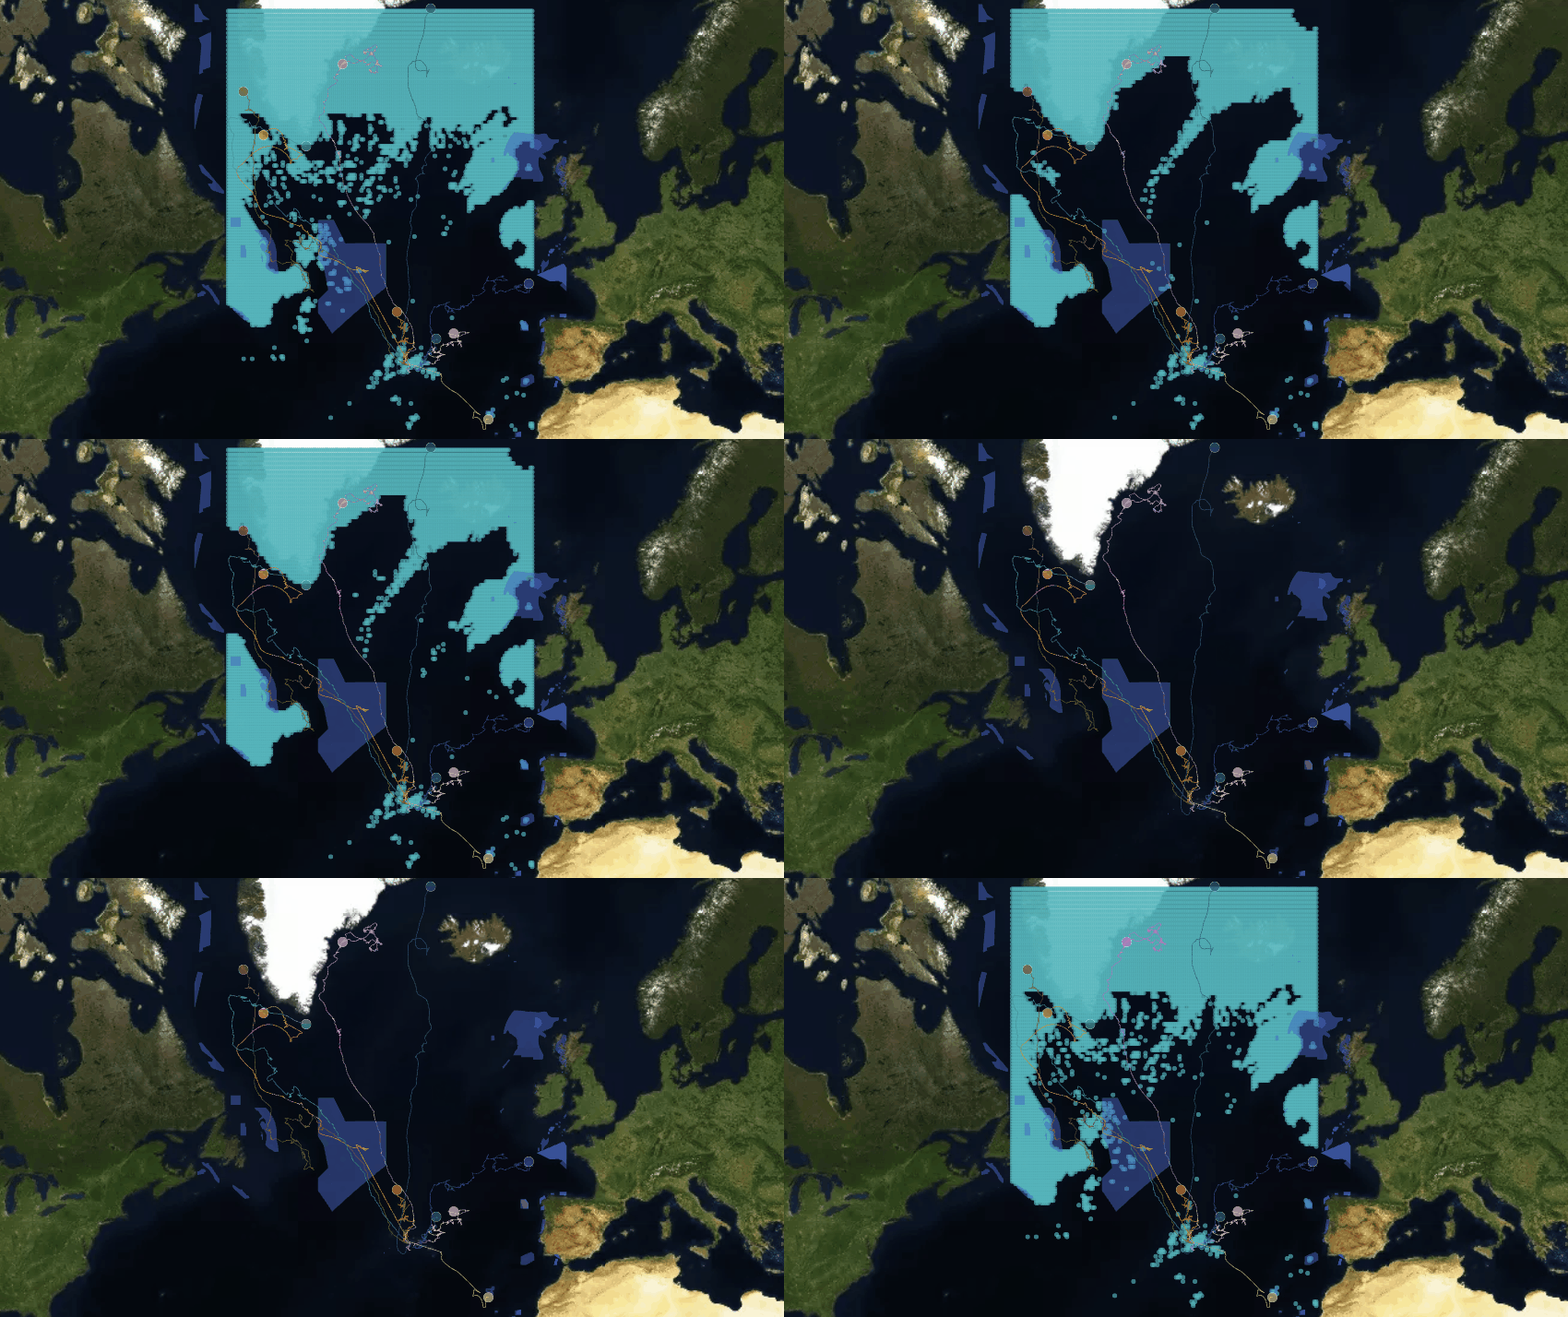
Map Gallery - 12 month Phytoplankton concentration with Great whales[1] summer migration routes to the Arctic
This map gallery shows the products obtained with the “Wildlife Tracker for Oceans” developed for the Blue Cloud Hachathon 2022. The geo-framework is able to connect real time data from Argos satellite for animal tracking and data from Copernicus marine constellation for ocean bio-physic data.
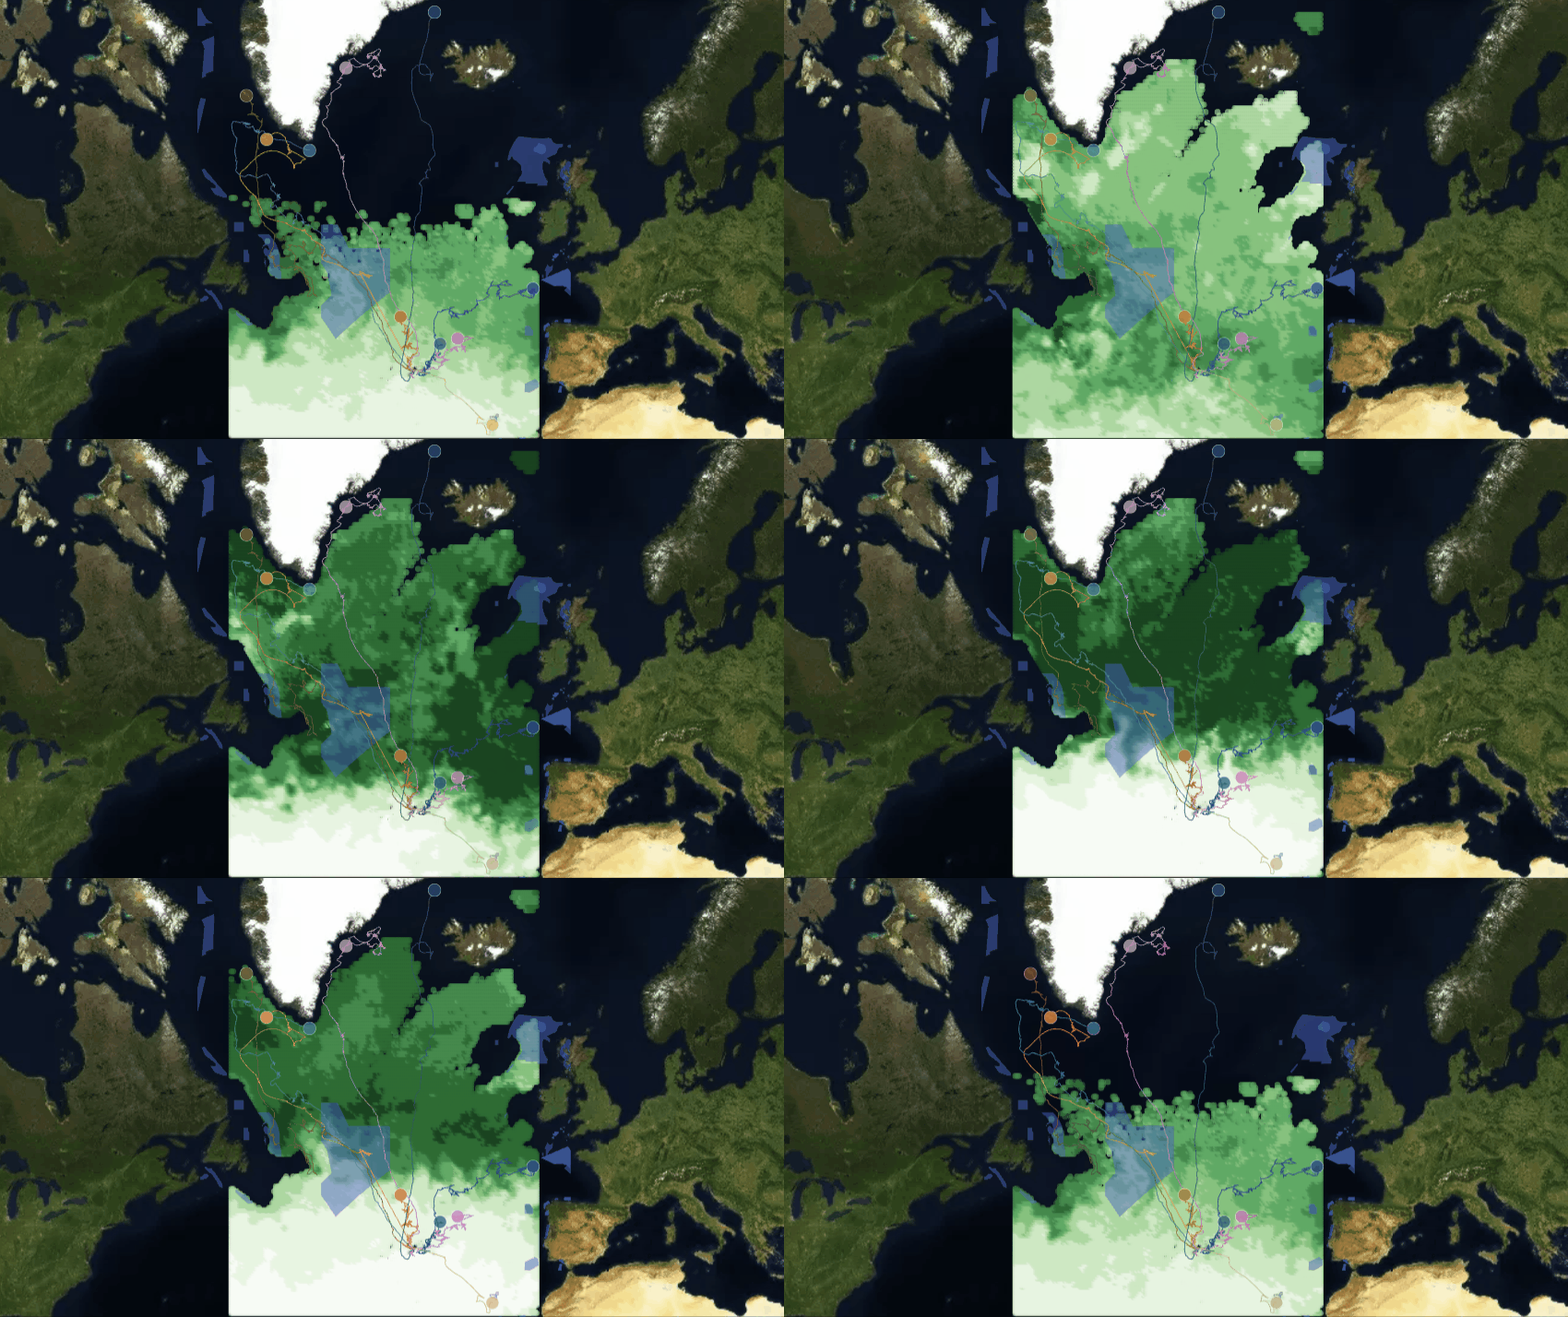
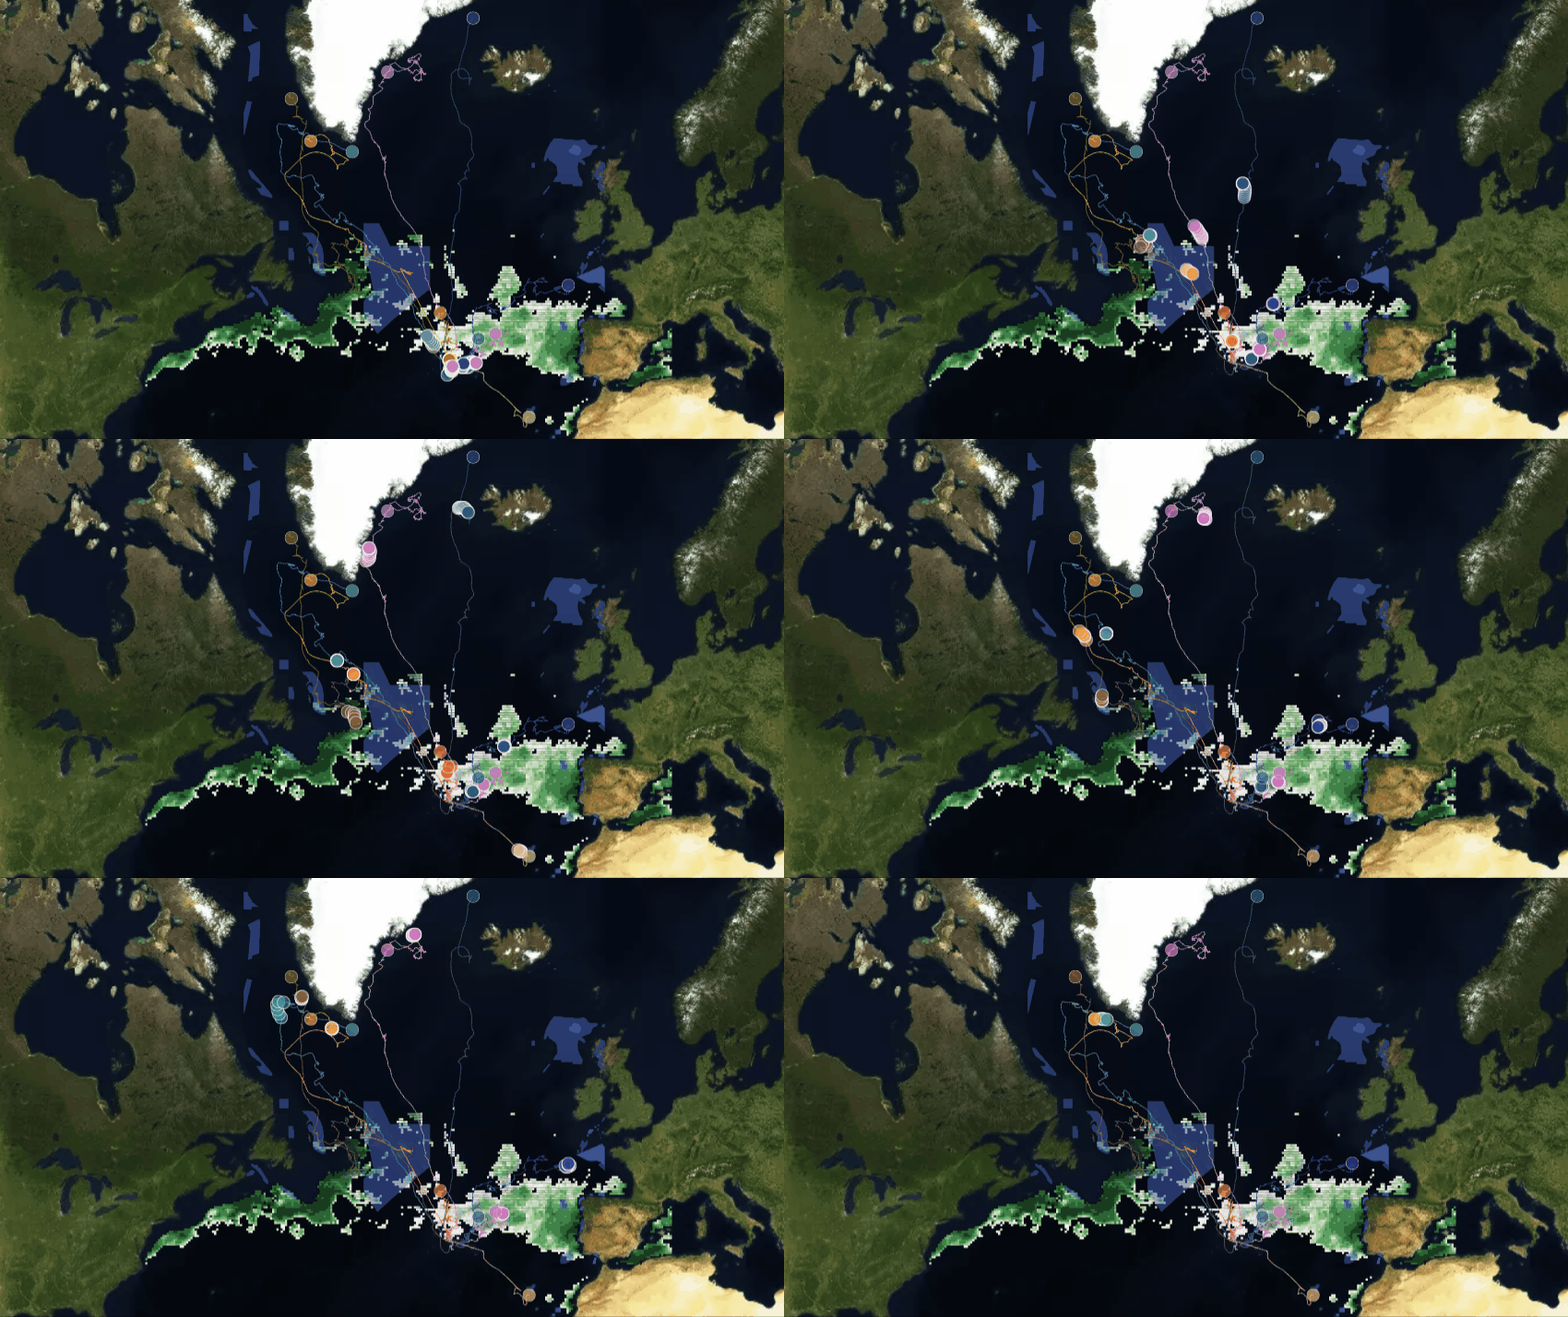
In this gallery, it is good to enphasise that Blue Cloud provided a relevant data product: Global ocean 3D Phytoplankton product of Chlorophyll-a concentration as proxy of Phytoplankton biomass[2] and it is represented as hotspot (>80% percentile) by each month.
-
Find a video about how the framework worked: “Wildlife Tracker for Oceans demo tutorial”
-
Check the code in this notebook and create maps like this by yourself: Notebook for Phytoplankton hotspots
-
If you have questions get in touch. Contact: bryanvallejo16@gmail.com
1) Demo: Marine Wildlife Movements and Marine Protected Areas (MPAs)[3]
Access the webmap in the next link: Great Whales summer migration movements
2) Product 1: Monthly changes during 2018 of Phytoplankton concentration
Access the webmap in the next link: Yearly phytoplankton concentration
3) Product 2: Hotspots of Phytoplankton concentration overlapped with Great Whales summer migration
Access the January webmap in the next link: January phytoplankton hotspots
Access the June webmap in the next link: June phytoplankton hotspots
All 12 months of Phytoplankton hotspots
- Phytoplankton hotspots on January
- Phytoplankton hotspots on February
- Phytoplankton hotspots on March
- Phytoplankton hotspots on April
- Phytoplankton hotspots on May
- Phytoplankton hotspots on June
- Phytoplankton hotspots on July
- Phytoplankton hotspots on August
- Phytoplankton hotspots on September
- Phytoplankton hotspots on October
- Phytoplankton hotspots on November
- Phytoplankton hotspots on December
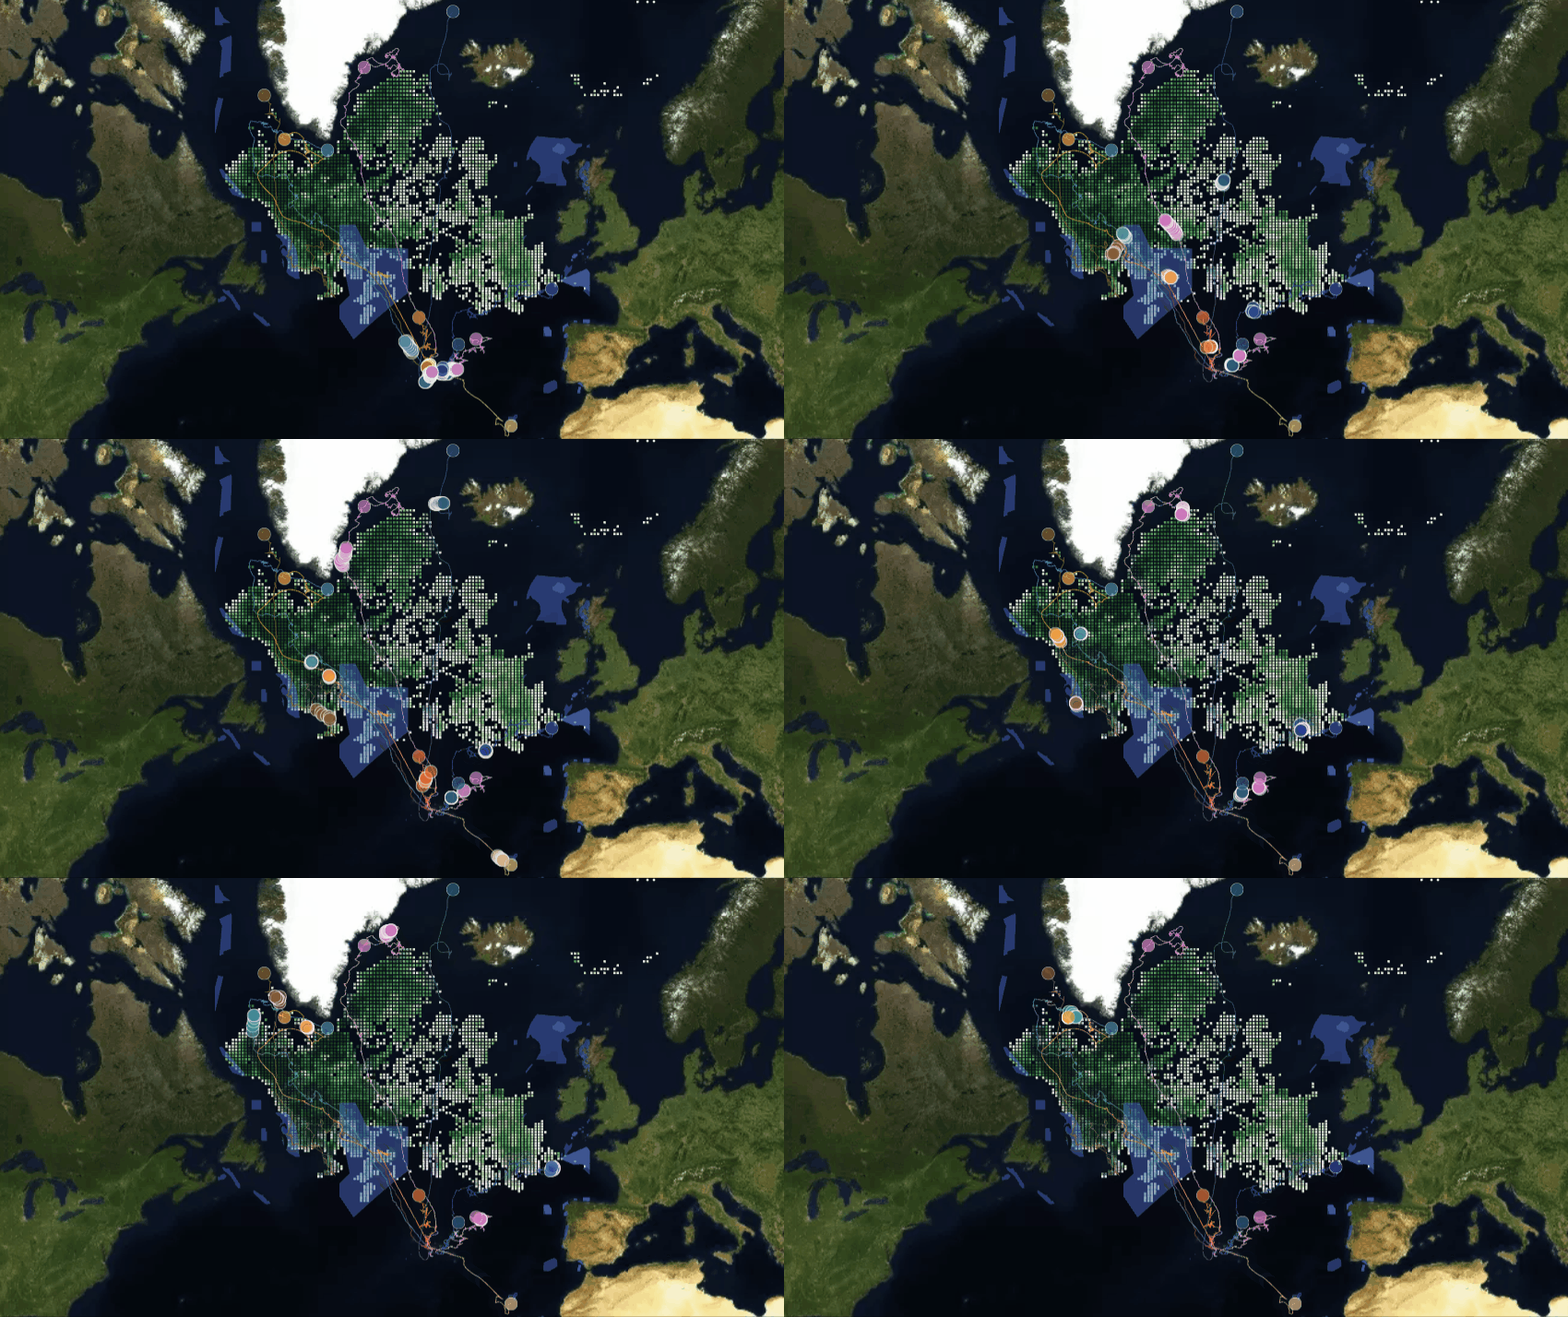
4) Bonus. Data gaps and whale movements
Access the Data gaps webmap in the next link: Data gaps and whale movements
5) References
- [1] Silva et al (2014). North Atlantic blue and fin whales suspend their spring migration to forage in middle latitudes: building up energy reserves for the journey
- [2] Sauzede et al (2015). Phytoplankton data products from Blue Cloud
- [3] UNEP-WCMC and IUCN (2022), Protected Planet: The World Database on Protected Areas (WDPA) and World Database on Other Effective Area-based Conservation Measures